

Body Pressure Mapping Applications
Demonstrating How Tactile Pressure Mapping is Used to Improve Consumer Products, and Human Health & Safety Equipment
In today’s connected society, online customer reviews greatly impact products. While online shopping provides access to a global marketplace, it also invites more opportunities for criticism.
Every user experiences a product, device, or tool differently, but search engines, online reviews, and social media can shape consumer opinions instantly. Feedback such as poor fit, early failure, or difficult operation may discourage potential buyers. For design engineers, however, these comments offer valuable opportunities to gain a competitive advantage. Products designed to be used or worn by people must therefore be evaluated in realistic, true to life testing environments to improve quality and the overall user experience.
When analysing how people interact with products and devices, or how well wearable products fit them, pressure mapping technology reveals insights that other methods may miss. Ultra-thin, flexible sensors and intuitive digital analysis software enable design engineers to capture measurable pressure-contact data from almost anyone, virtually anywhere.
While no product can meet every user’s expectations, pressure mapping technology gives design engineers valuable ways to identify and address the needs of a more diverse population.
Here are examples of applications of Tekscan’s pressure mapping technology that have delivered valuable insights into consumer products.
Body Pressure Distribution Analysis
Pressure mapping helps design engineers create products that accommodate natural shifts and movement in the human body.
People rarely remain completely still while sitting or lying down, so understanding how peak pressure points change as users adjust their position gives R&D teams valuable insight into comfort requirements. This data can also support competitive benchmarking.
CASE EXAMPLE: Creating an Ergonomically Satisfying Driving Experience
Ergonomic pressures change as a driver makes different movements like accelerating or applying brakes. Car seat R&D teams can use this information to develop better seat designs that accommodate specific driving activities.
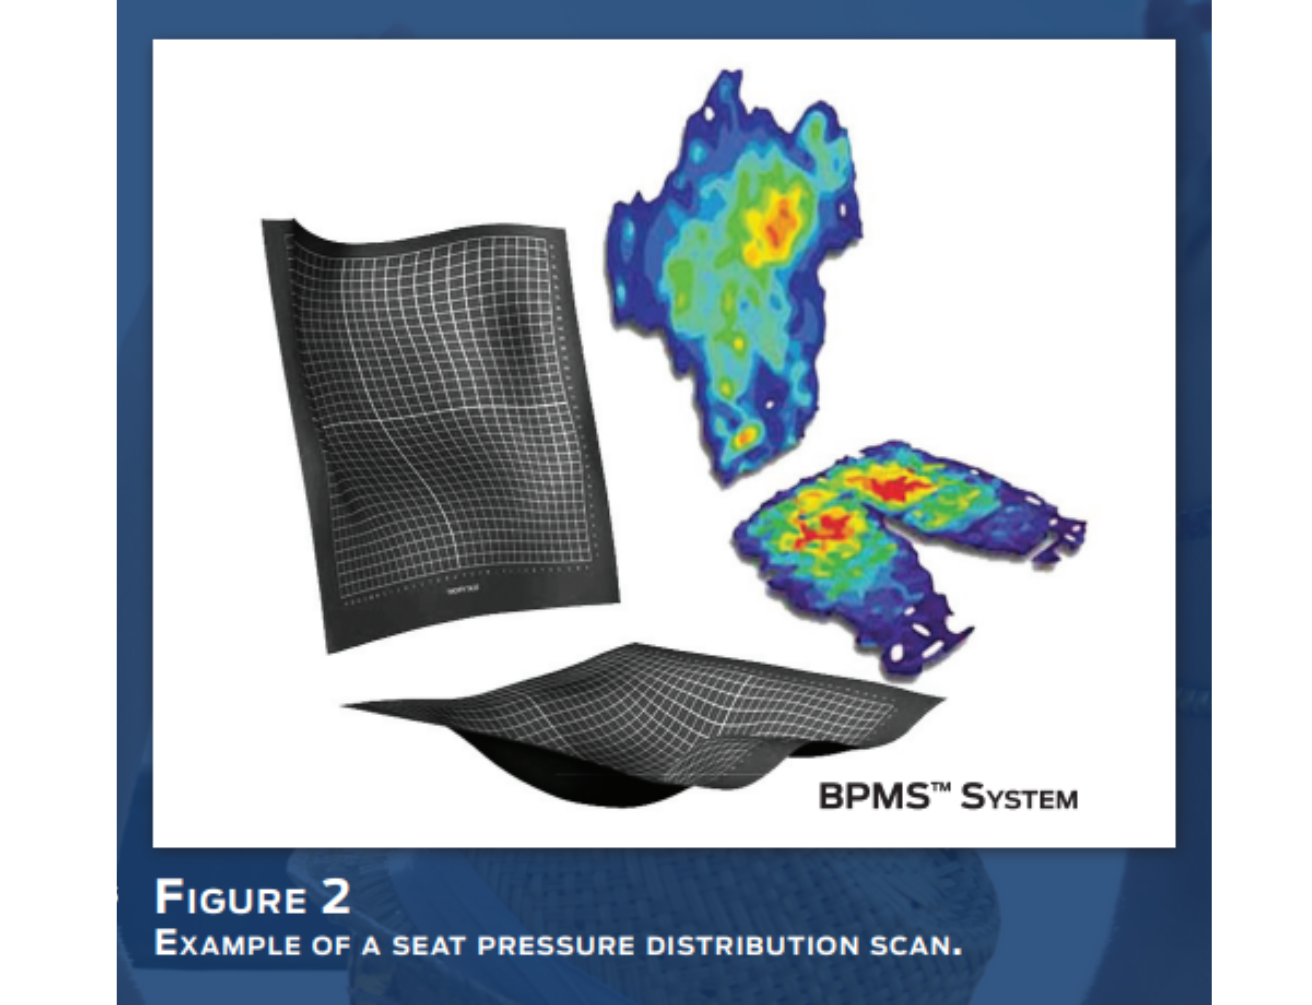
The image shown illustrates how an automotive R&D team used pressure mapping to show the dynamic inter-relationship of seat back and cushion pressure when the driver pushes the brake pedal. This information helped the team determine peak pressure zones and predict pressure changes over time. From there, the team could more accurately assess the effects of stitching, bolsters, wire stays, foam stiffness, seat angles, lumbar supports, and cover materials used in the design.
Packaging Grip Test
Pressure mapping helps quantify grip force to help create product packaging that’s easier to use. Packaging design engineers are challenged on two fronts. First, their packaging design must be constructed sturdy enough to withstand physical impacts and outside hazards. On the other hand, packaging that’s too difficult to open or use can be a turnoff to consumers. Clear, quantifiable data on grip force can help design engineers satisfy customer demands.
CASE EXAMPLE: Achieving a More Functional Packaging Design
Packaging can be expensive, especially when it comes to consumer goods.
Many product manufacturers make significant investments to test different materials and designs, in an effort to control production costs and limit waste.
These experiments often include user experience tests.
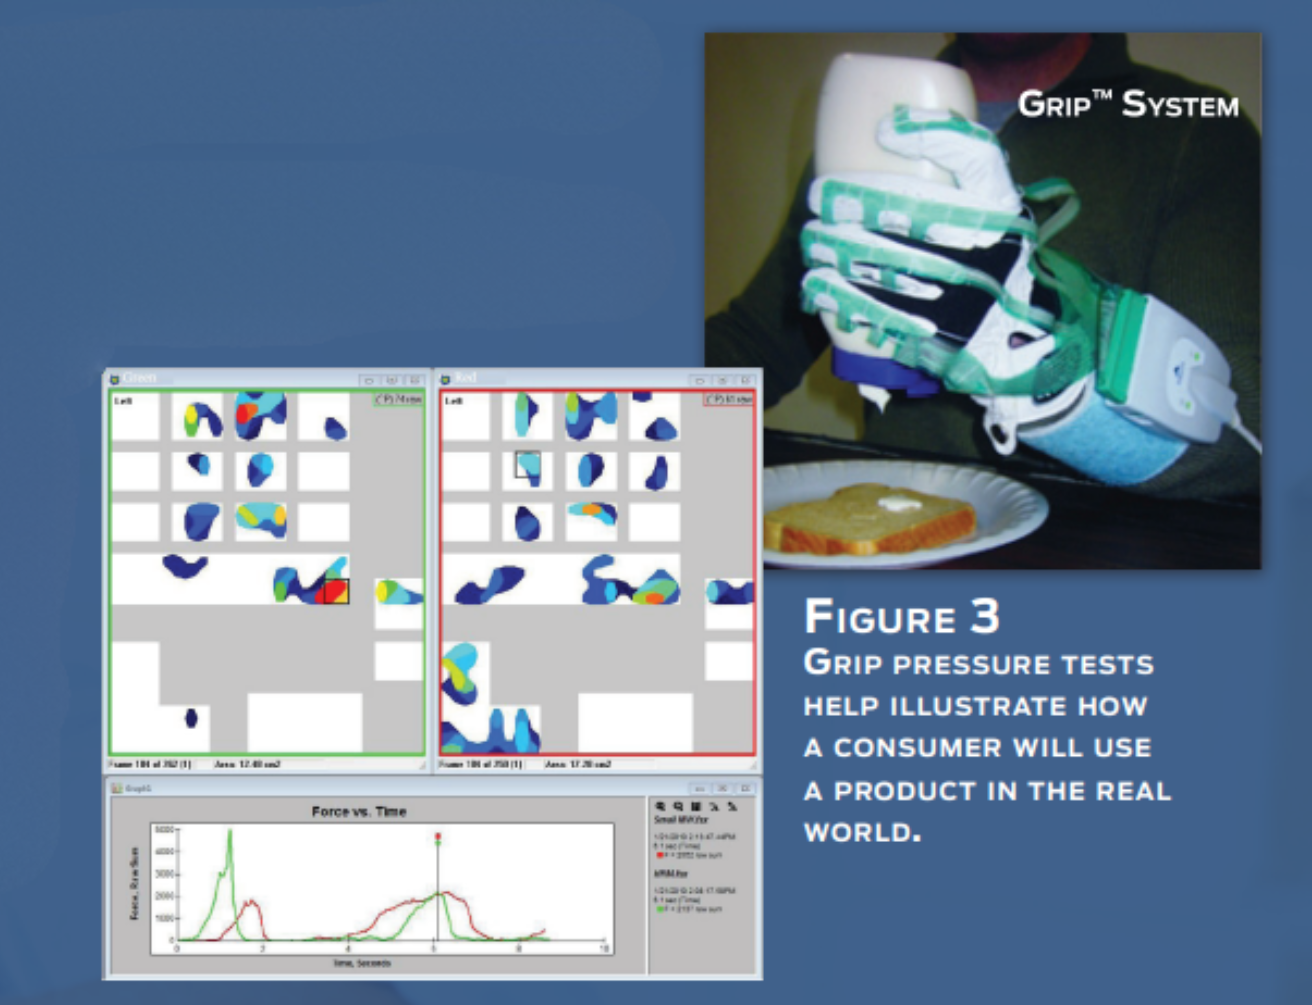
Grip pressure mapping systems, as shown in this picture, measure the amount of force to open, squeeze, and close a new dispensing container prototype.
In this test, the packaging designer conducted a comparison between two different mayonnaise containers to determine which design was ergonomic and functional. As shown on the “Force vs Time” graph, the first brand (green) required more force to open, while the other brand (red) was more difficult to squeeze.
Headwear Fit & Comfort
Pressure mapping is a minimally invasive tool that helps design engineers achieve the right fit for their products and devices.
A group of design engineers faced developing a wearable product to accommodate the ergonomic needs of the general public, pressure mapping was one of the reliable technologies to help create a comfortable design.
CASE EXAMPLE: Enhancing the VR Experience
When using VR, it’s important to have a comfortable experience. A person can’t fully immerse themselves in a virtual world if they’re experiencing discomfort in the real world.
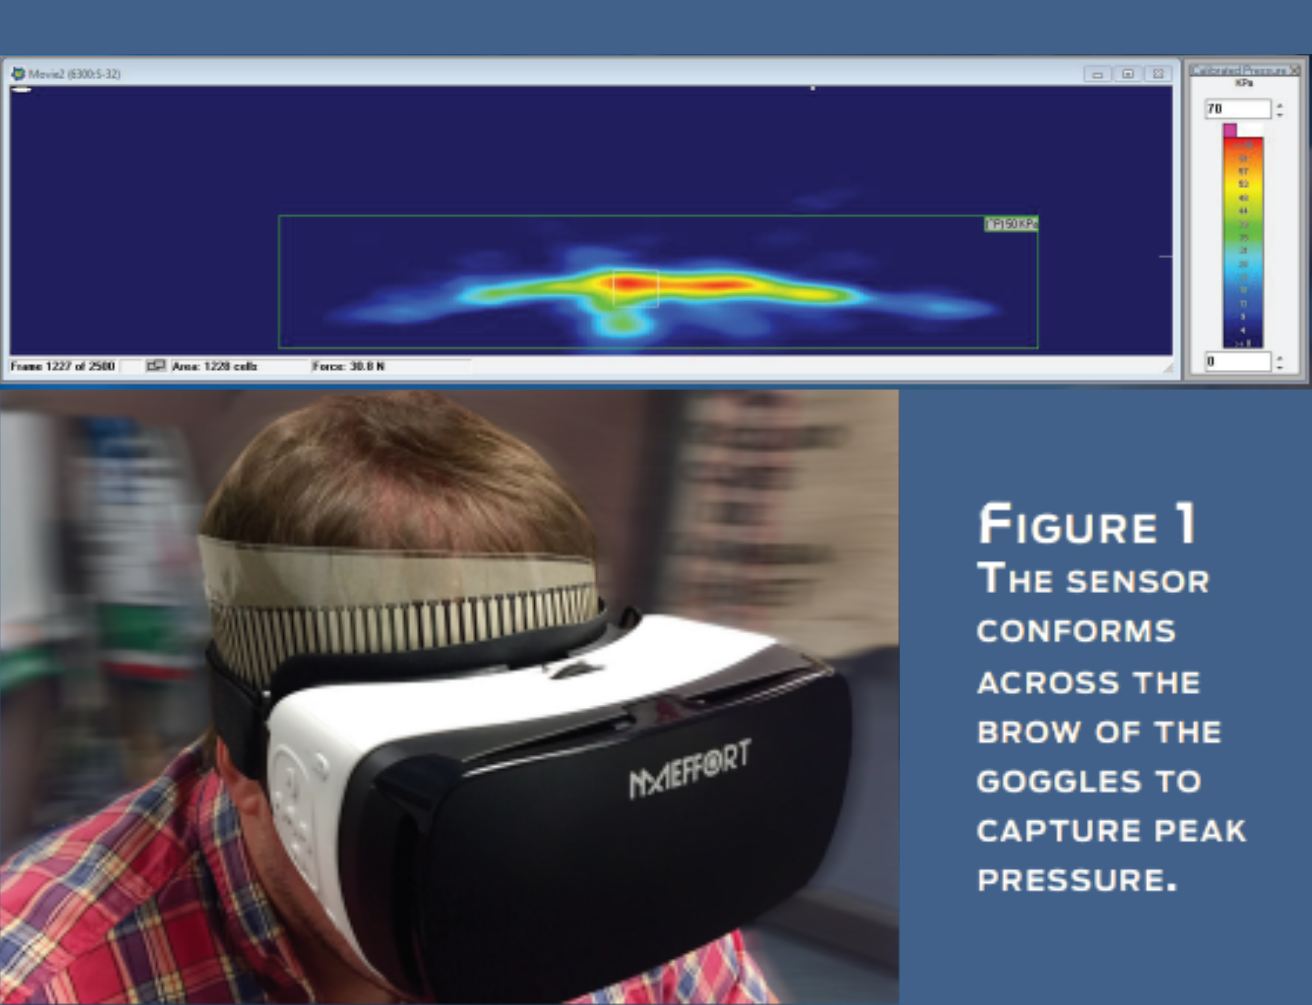
In a recent R&D application, pressure mapping sensors were
positioned around the contact points of VR goggles to determine
areas of peak pressure experienced. Design engineers could monitor how these pressures would shift or change as the user moved their head or made sudden movements.
Also, taking into consideration that a subject wearing VR
goggles may not be as aware of their surroundings, pressure
mapping technology also helped determine how the subject
could be impacted in case of a collision. This contact data could
also help the design engineers improve the durability of their goggle designs.
These application examples are examples of R&D teams using Tekscan pressure mapping solutions. Here at Techni Measure, we understand the challenges R&D teams face, and alongside our expertise and Tekscan pressure mapping solutions, we are confident we can find the right solution for you. Contact us today to learn more!
