I-Scan™ is an advanced tool that accurately measures and analyses the pressure at the interface between two surfaces, using a thin and flexible sensor. The versatile I-Scan™ tactile pressure mapping system can be customised by selecting from over 200 pressure sensors to match your specific application needs.
Contact us for pricing!
Versatile Pressure Mapping Systems
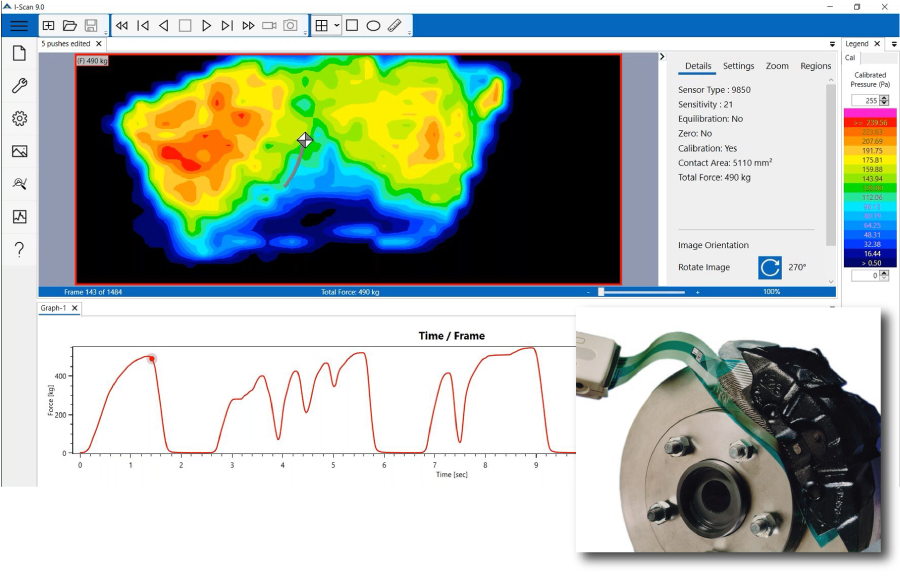
Key Data:
- Total force
- Pressure distribution
- Peak pressure
- Center of force
- Forces in different areas
Utilisation:
- Test & measurement
- Research & development
- Design validation
- Machine set-up
- Quality control
Our Range of Sensors
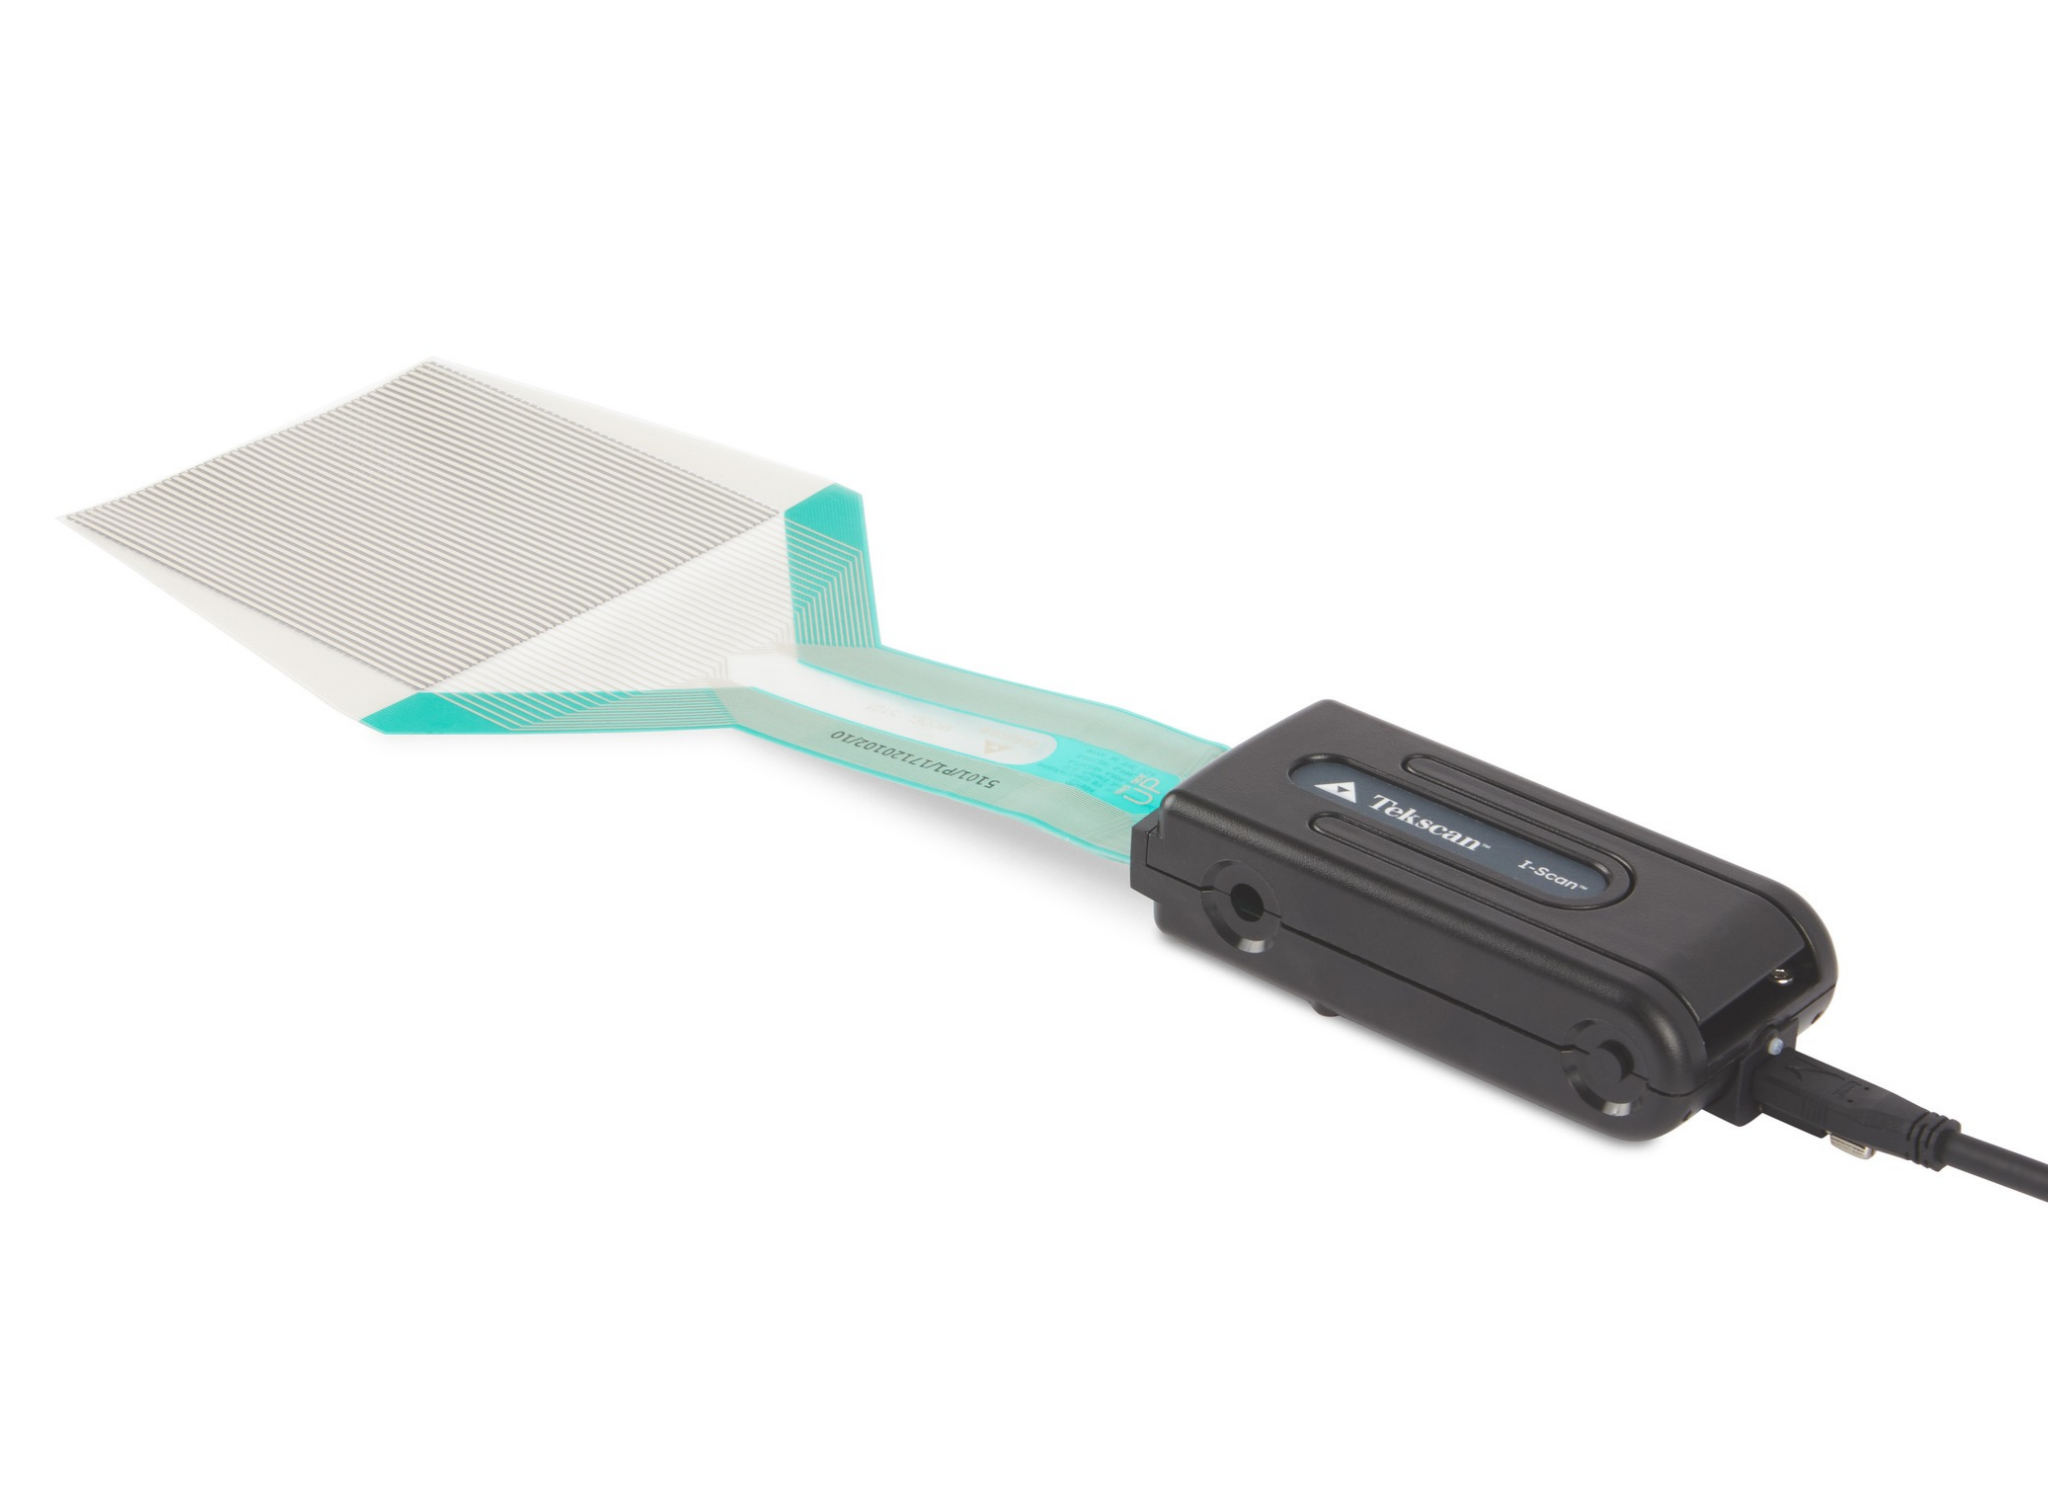
Over 200 flexible, thin film tactile pressure sensors are available in different sizes, shapes, resolutions, temperature ratings, and pressure ranges (up to 25,000 psi or 1,700 bar).

- High spatial resolution
- Up to 248 sensing elements/cm2 (1,600 sensing elements/in2)
- Sensing elements with as narrow as 0.6 mm (0.02 in.) spacing
- Sensing area ranging from 3 mm x 3 mm (.12 in. x .12 in.) to up to 1,734 mm x 1,768 mm (68 in. x 69 in.)
- Temperature Mapping Sensors are now available for complete surface sensing data.
- Optional high-temp sensors can withstand up to 200°C (392°F)
- Fully customised sensors can be manufactured
- Increase the distance between your sensor and electronics with our reusable tab extenders
Watch This Video To Learn More About The I-Scan™ 10 System
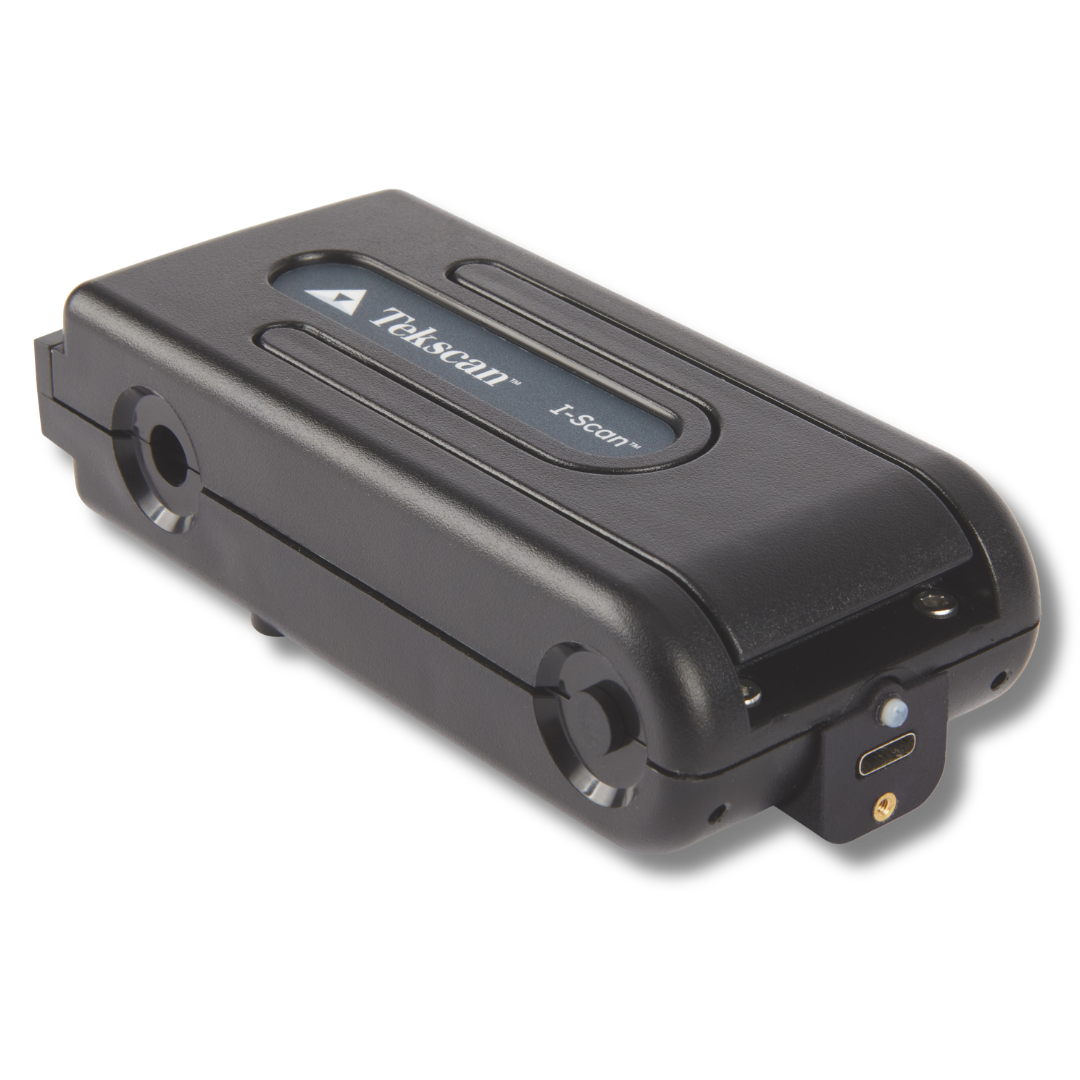
Electronics
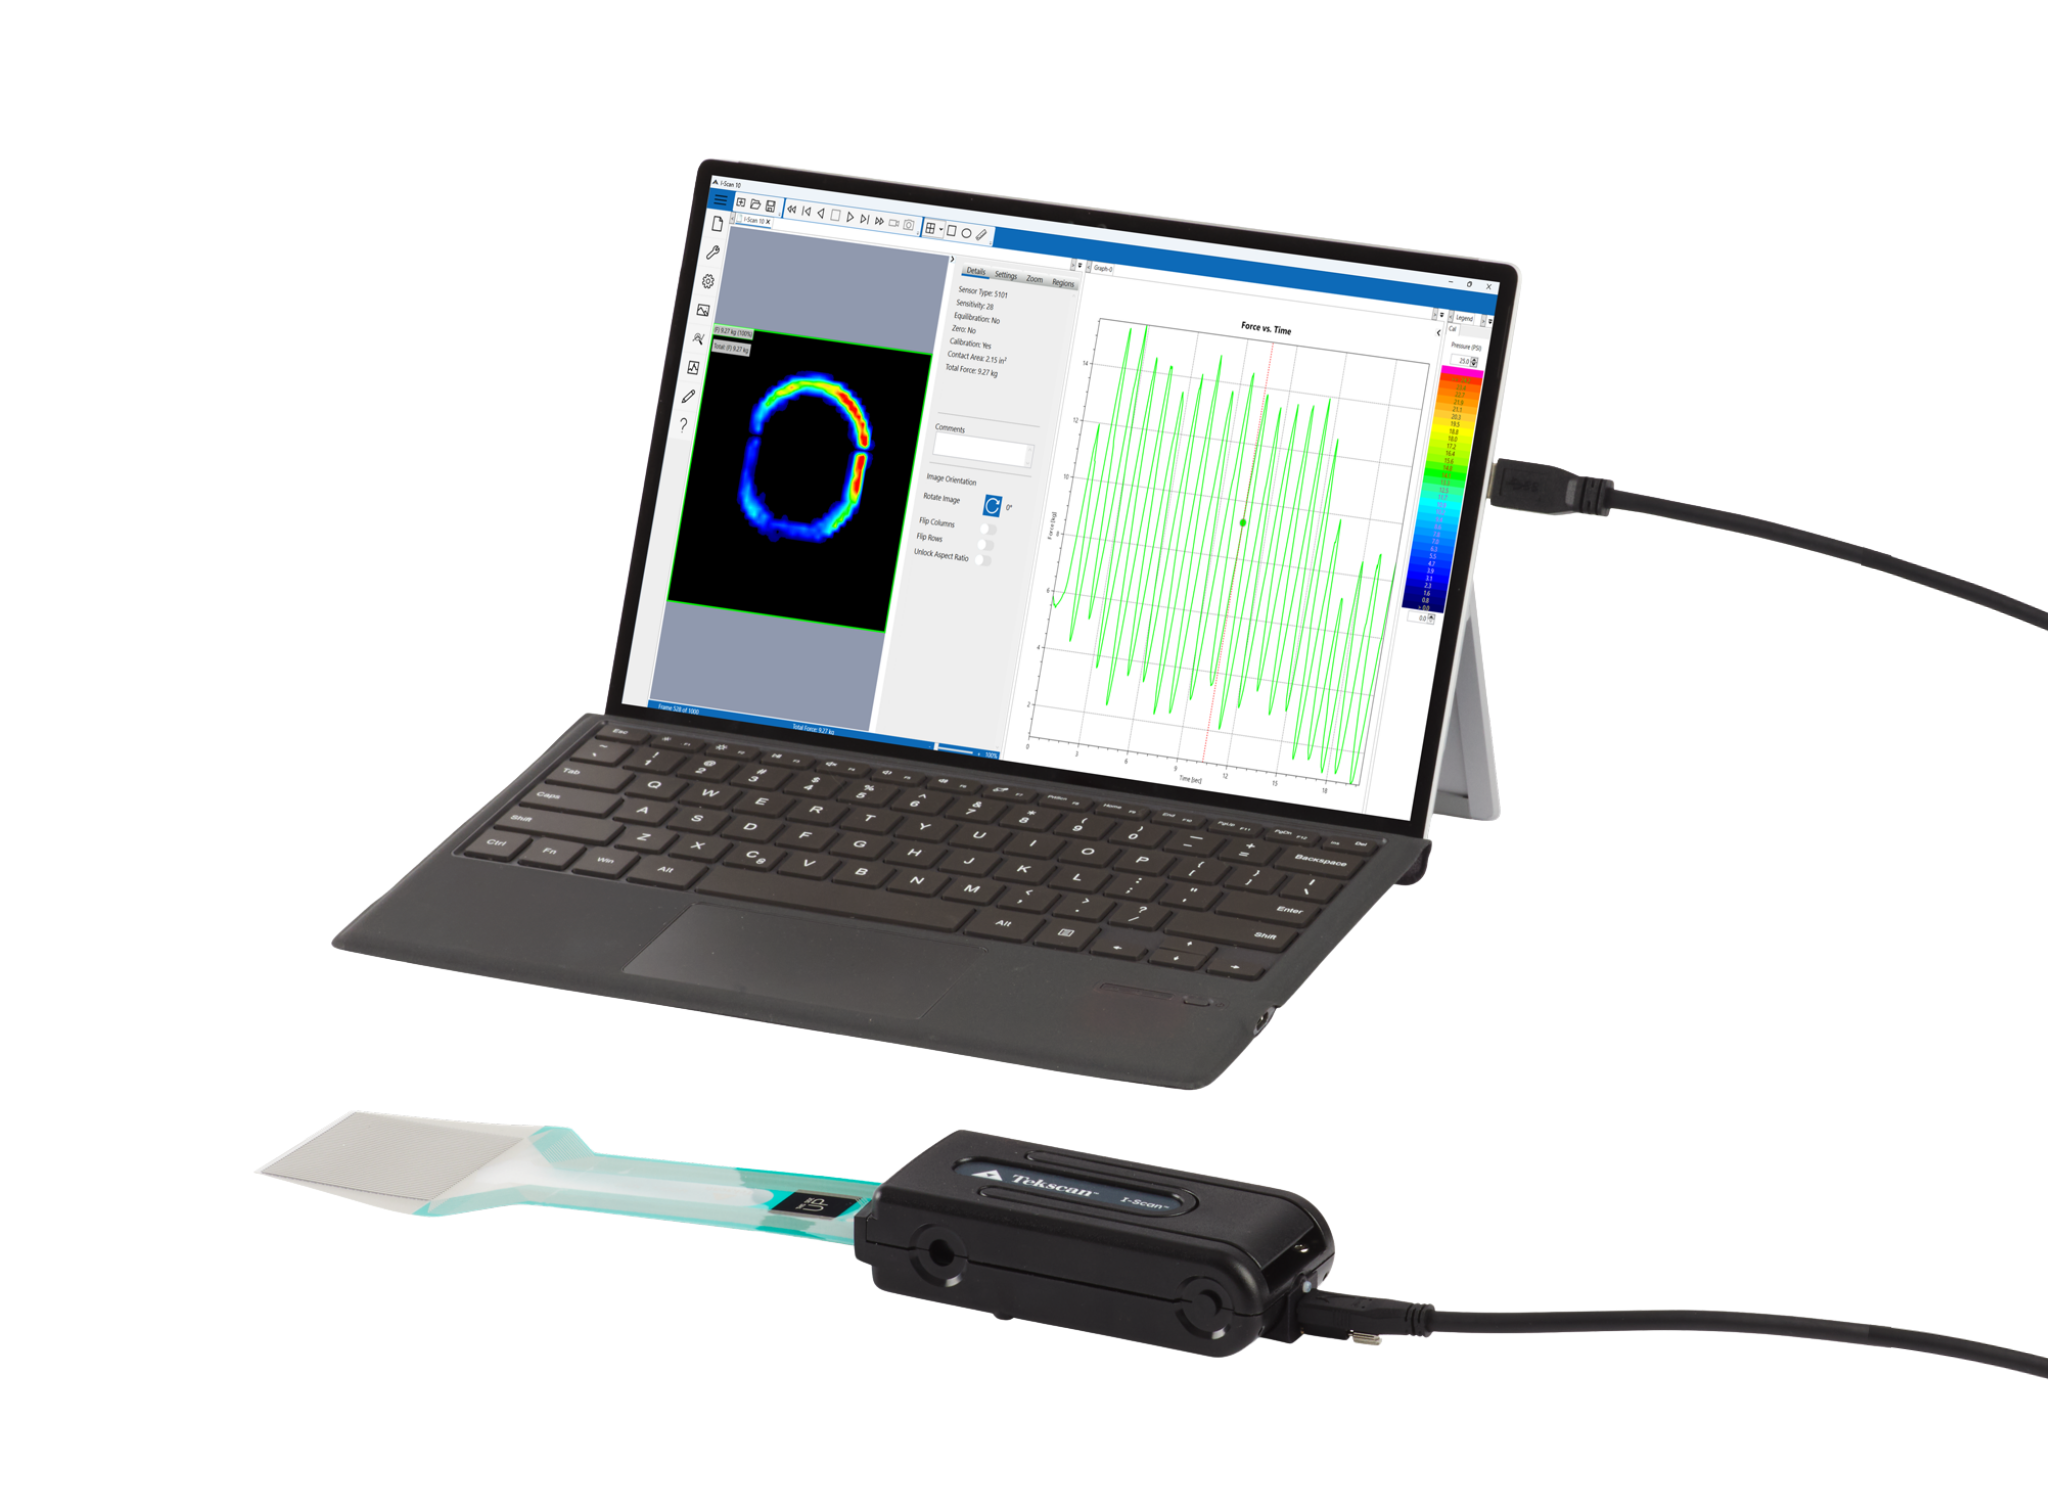
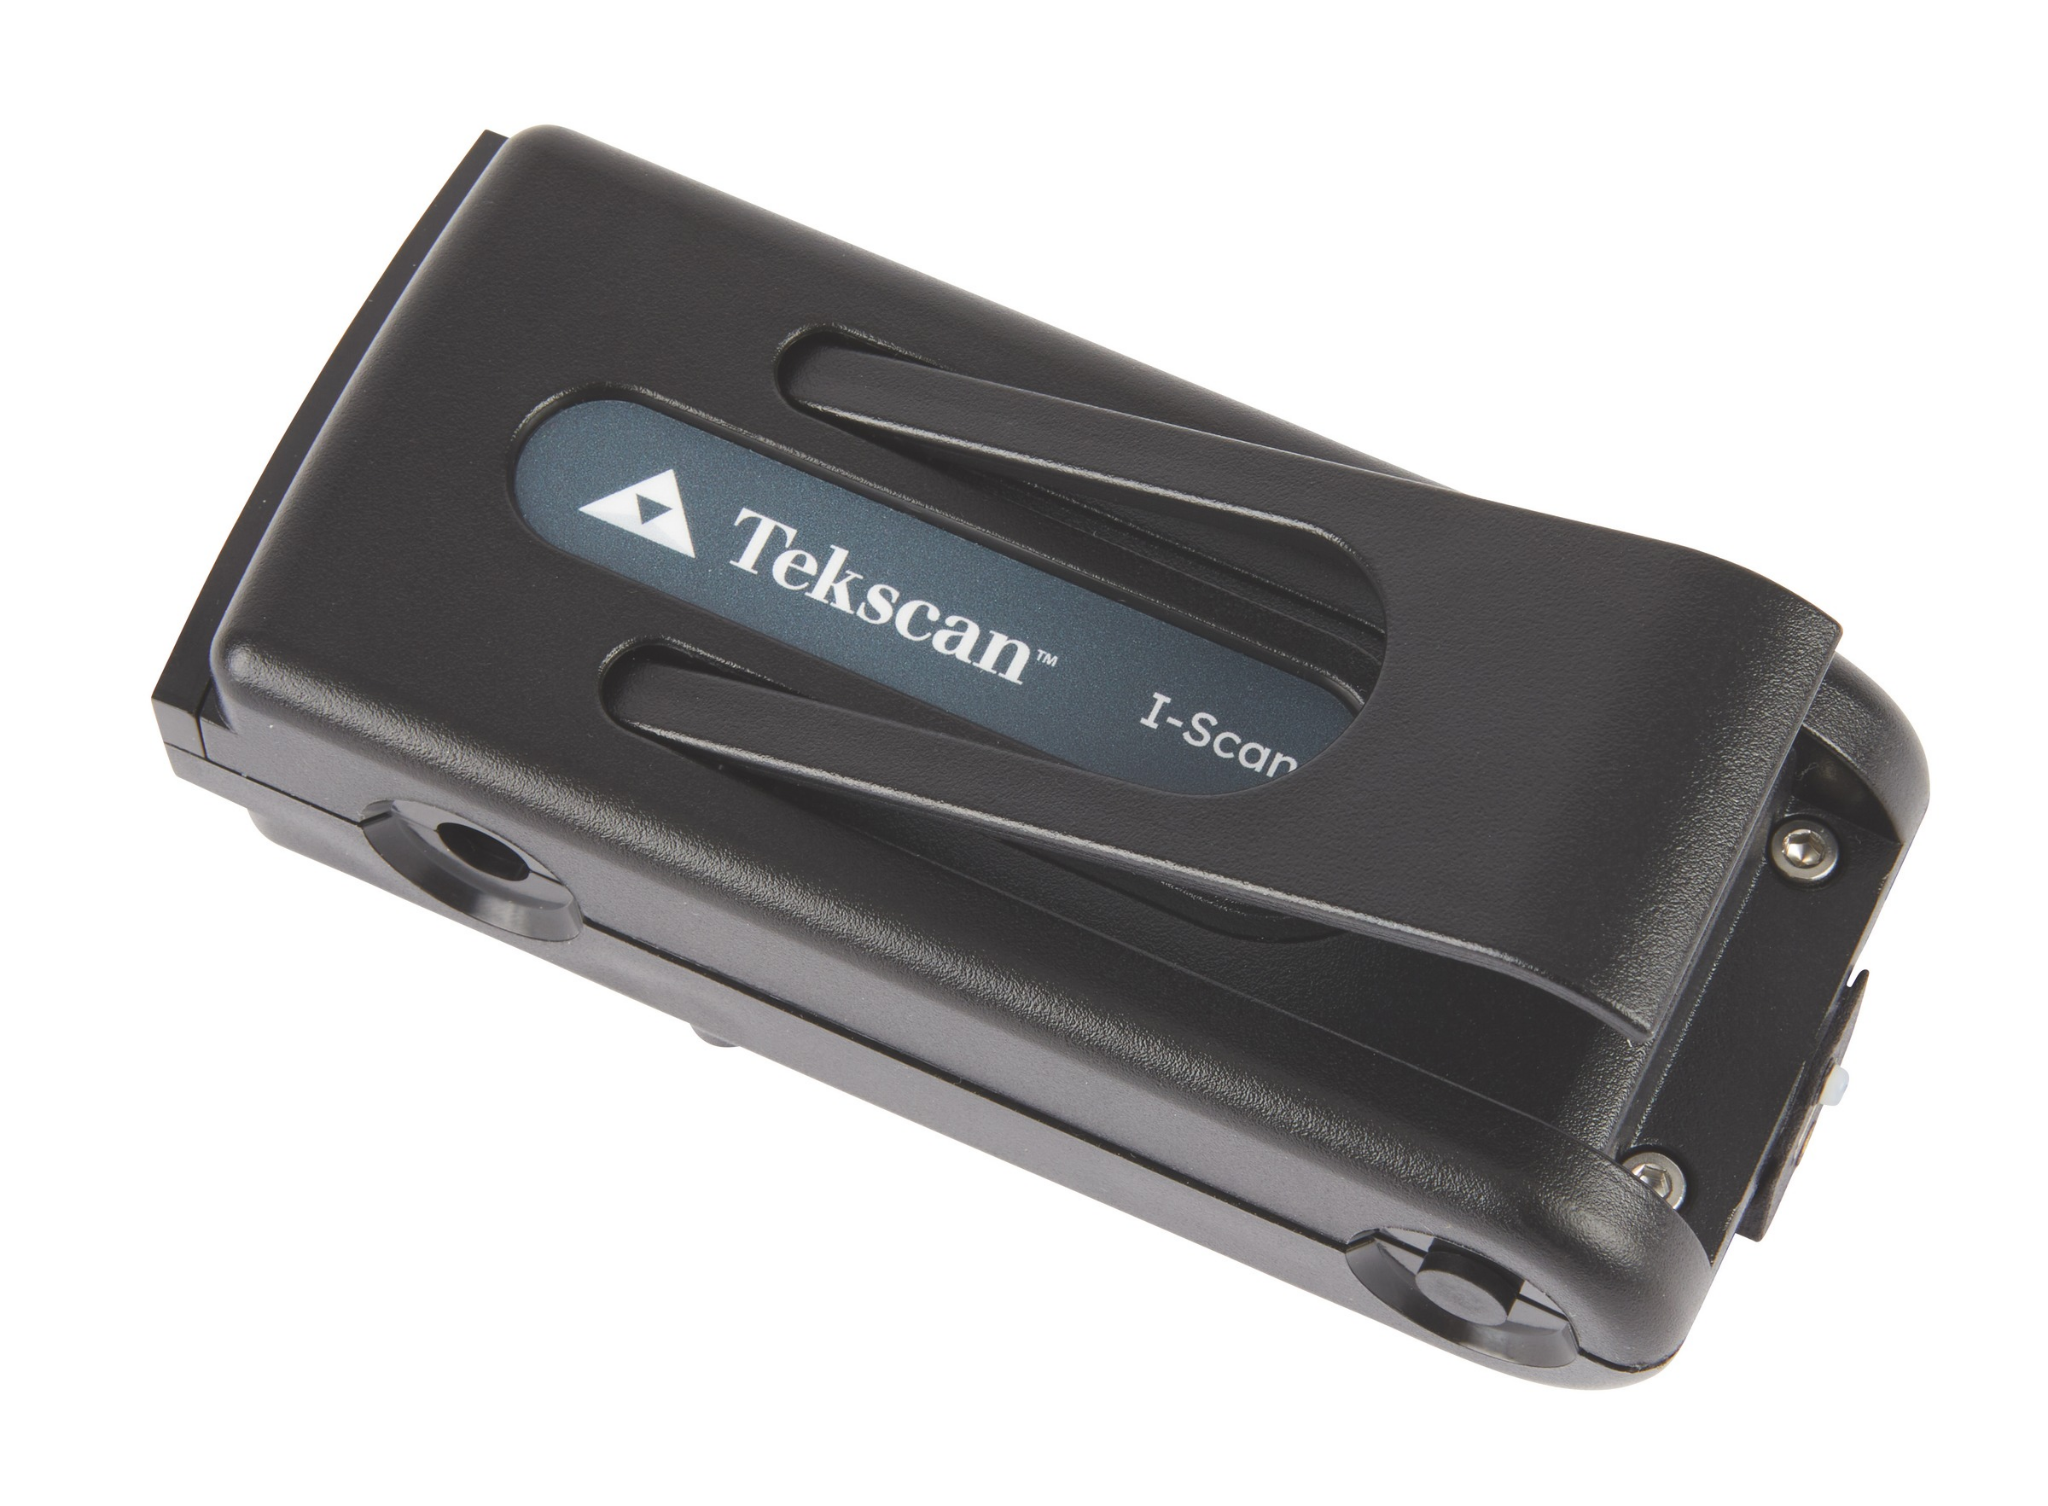
The TekDAQ™ 220 rapidly scans pressure sensor data and relays it to I‑Scan™ 10 software for real-time visualisation and analysis.
Designed for demanding test environments, its industrial-grade electronics provide enhanced ESD protection and improved resistance to electrical noise.
For full specs, download the datasheet.
Superior Data Analysis
I-Scan™ provides the tools for more comprehensive and higher-quality analysis than ordinary pressure-sensing technologies. The software displays the pressure distribution data in multiple formats for superior analysis.
Key Features:
- Real-time sensor data viewing
- Visualisation enhancements of the pressure image
- 2D & 3D representations
- Interpolation, contours & averaging for a clearer image
- Pressure displayed in engineering or relative units
- Single & multi-point calibration
- Analysis tools
- Centre of force & trajectory
- Peak force and contact area identifiers
- ASCII export capability
- Save as AVI
- Sensor scan rate up to 20 kHz
- Graphical analysis of real-time or stored data
- Total force
- Contact area
- Contact pressure
- Peak force
- Peak contact pressure
Graphic & Data Analysis
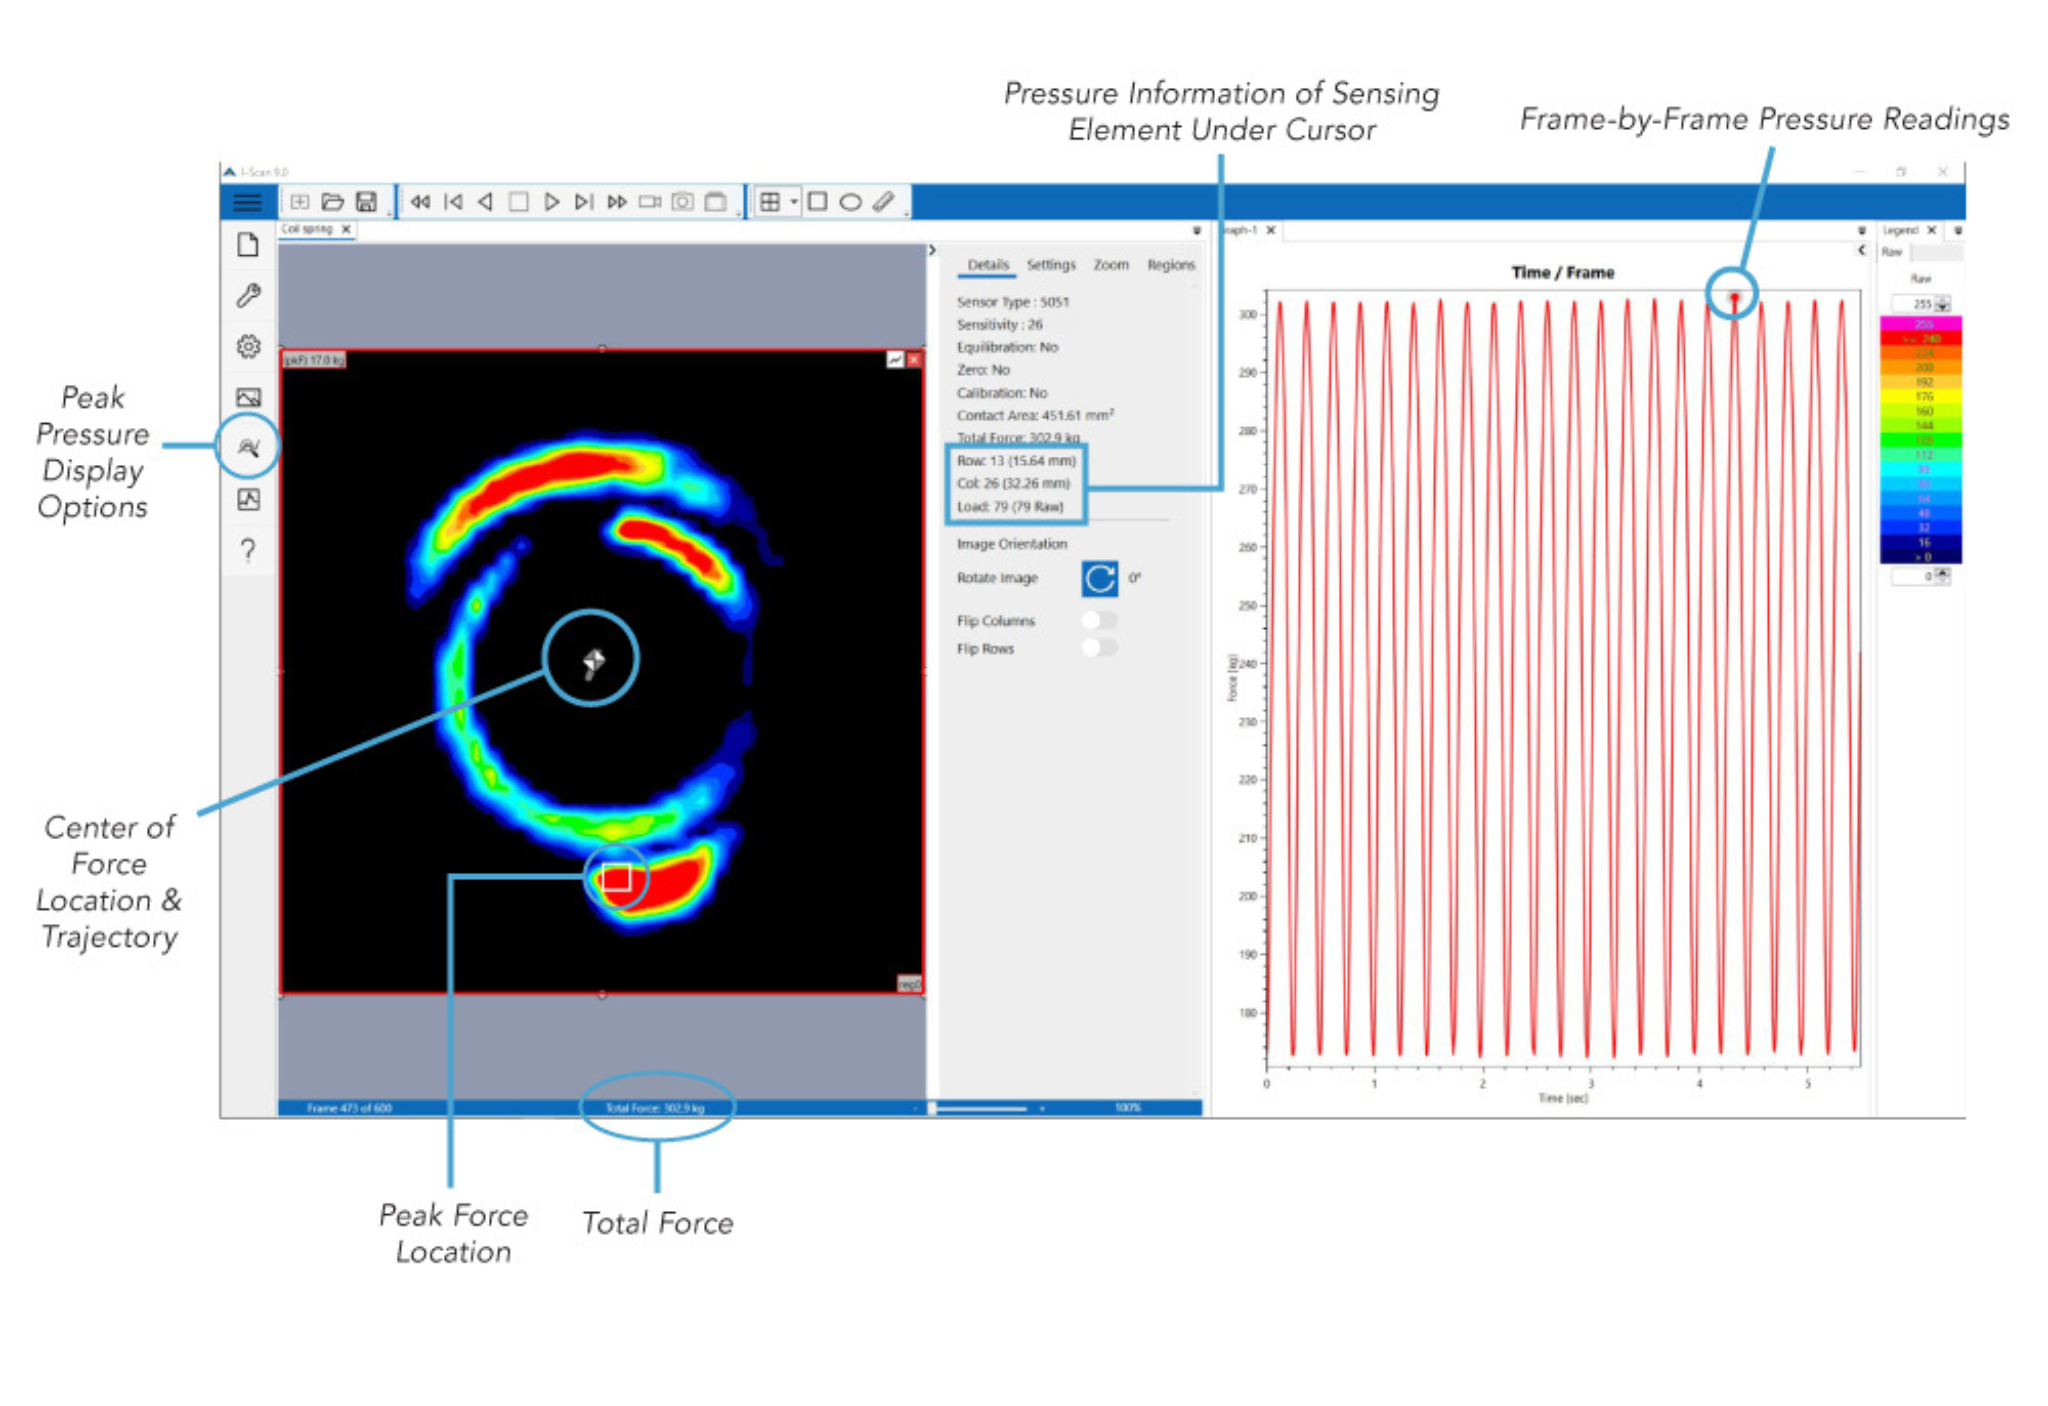
With the ability to capture force over time, users can click at any point of a pressure mapping recording to view the resulting pressure output image.
Data from each frame includes:
- Total Force
- Centre of force location
- Peak Pressure
- Pressure Distribution (e.g. force on each sensing element)